The use of Geographic Information Systems (GIS) in fisheries and aquaculture is becoming increasingly popular.
GIS technology allows for the collection, analysis, and visualization of data from a geographic perspective, making it ideal for managing resources in these industries.
Through the application of GIS technology, researchers are able to better understand fisheries and aquaculture ecosystems and their various species.
This article will explore different ways that GIS can be applied to fisheries and aquaculture research and management.

Applications of GIS in Fisheries Management
Fisheries are the commercial, recreational, and subsistence activities that involve the catching, processing, and selling of fish, shellfish, and other aquatic organisms.
This includes the harvesting of wild fish as well as the farming of fish and other aquatic species in aquaculture.
Fisheries management is the process of regulating and overseeing these activities to ensure sustainable use of fish stocks and to protect the ecosystems that support them.
GIS technology is being increasingly used by fisheries managers to help better understand and manage fish populations.
GIS technology is used extensively in fisheries management, with a wide range of applications that include:
Model Environmental Factors Influencing Fish Populations forecast the effects of climate change on marine ecosystems
GIS can also be used to model the environmental factors that influence fish populations.
By understanding how factors such as water temperature, salinity, depth, and nutrient levels affect fish, fisheries managers can develop strategies for managing these resources in a way that is sustainable and minimizes negative impacts on the ecosystem.
Monitoring Fish Populations Distribution & Behavior
GIS can be used to analyze large amounts of spatial data related to fish populations, such as catch data, survey data, and oceanographic data.
This can be used to identify patterns and trends in fish populations, distribution, and habitats, which can inform management decisions.
Marine Habitat Mapping
GIS can be used to map and classify marine habitats, such as coral reefs, seagrass beds, and kelp forests.
This can be used to identify important habitats for fish and other marine life, and to assess the condition of these habitats.
Habitat suitability modeling: GIS can be used to create models that predict the suitability of different areas for different fish species based on environmental factors such as water temperature, salinity, and depth.
Assessing the Vulnerability of Particular Fish Species to Climate Change
GIS can be used to monitor the movements of fish and other marine organisms using telemetry and satellite tracking data. This can be used to understand the distribution and migration patterns of fish populations, which can inform management decisions.
Establishing Marine Protected Areas
Fisheries management: GIS can be used to create management plans for fisheries, including the identification of marine protected areas and the management of fishing activities.
Study the Effects of Fishing on Marine Ecosystems
GIS can be used to create maps and models that assess the impacts of fishing on marine ecosystems. This can include the impacts on fish populations, marine habitats, and the overall health of the ecosystem.
It can be used to monitor the movements of fishing vessels, and the location of fishing gear, this can be used to identify illegal, unreported, and unregulated fishing.
Application of GIS in Aquaculture
For example, GIS can be used to identify suitable areas for aquaculture development, locate potential hatcheries and grow-out sites, and
Predict the Growth of Algal Bloom
GIS can be a powerful tool in predicting the growth of algae in a water body, providing valuable information to support water management decisions, and to prevent and mitigate harmful algal blooms.
GIS can be used to analyze remote sensing data, such as satellite imagery, to identify areas of high algal concentration. This can be used to monitor changes in algal growth over time, and to predict potential algal blooms.
GIS can be used to create models that predict the suitability of different areas for different types of algae based on environmental factors such as water temperature, salinity, and nutrient levels.
GIS can be used to monitor water quality, such as temperature, pH, and nutrient levels, in order to detect changes that could lead to algal blooms.
GIS can be used in conjunction with machine learning techniques to predict algal growth by identifying patterns in data, such as water quality and weather conditions, and making predictions about where and when algal blooms may occur.
Fish Stocks Assessment | Identify Potential Fishing Grounds
GIS can be used to track the movements of fish stocks in several ways:
Telemetry: GIS can be used to map the movements of fish using data collected from telemetry devices, such as acoustic and satellite tags.
These tags can be attached to fish, and transmit location data back to researchers. GIS can be used to analyze this data, and create maps and visualizations of fish movements.
Satellite imagery: GIS can be used to analyze satellite imagery to track the movements of fish stocks. This can include using imagery to identify areas of high fish concentrations, and to monitor changes in these areas over time.
Catch data: GIS can be used to analyze catch data, such as commercial fishing records, to identify patterns in fish movements.
This can include identifying areas of high fishing pressure, and assessing the impact of fishing on fish populations.
Oceanographic data: GIS can be used to analyze oceanographic data, such as water temperature and salinity, to identify areas that are suitable for certain fish species.
This can be used to track the movements of fish stocks in response to changes in ocean conditions.
Machine Learning: GIS can be used in conjunction with machine learning techniques to track fish movements, by identifying patterns in data and making predictions about where certain fish species may be found.
Suitable Site Selection
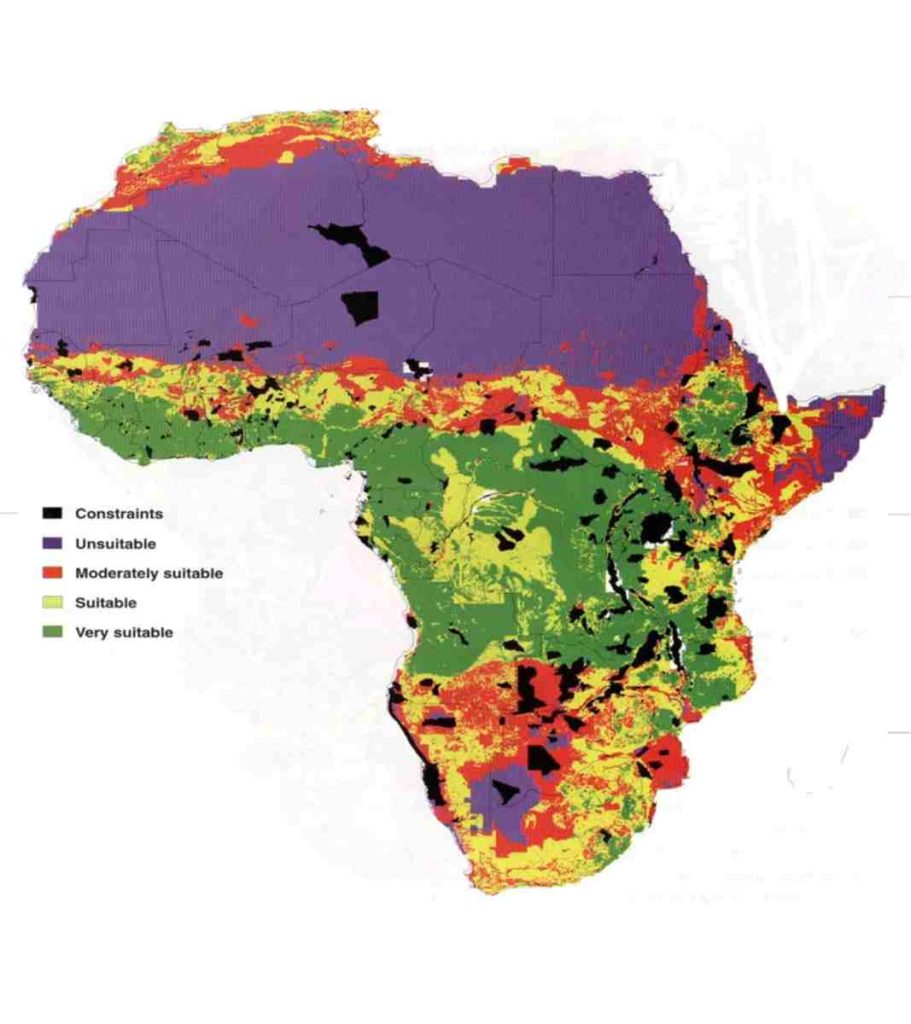
GIS can be used to assist in the selection of suitable sites for aquaculture by analyzing various spatial and environmental factors such as:
GIS can be used to analyze water quality data, such as temperature, salinity, and dissolved oxygen levels, to identify areas that are suitable for different types of aquatic species. This can include identifying areas with appropriate water depth and flow, as well as areas with good water quality and minimal pollution.
GIS can be used to map the seafloor, which can be used to identify suitable areas for aquaculture based on water depth, slope, and substrate.
GIS can be used to analyze wave exposure data, such as wave height and direction, to identify areas that are protected from strong waves and currents, which can be suitable for aquaculture.
GIS can be used to analyze transportation infrastructure and proximity to markets, which can be important factors in determining the suitability of a site for aquaculture, as it can be efficient to transport the product to the consumers.
GIS can be used to analyze zoning and regulatory information, such as marine protected areas, shipping lanes, and other existing uses of the ocean, to identify areas that are suitable for aquaculture from legal perspective.
Track the Growth and Spread of Aquatic Diseases
Optimize production by identifying the most productive sites and predicting how environmental changes will affect fish populations
Monitor Shellfish Farming & Distribution of Seaweed
GIS could be used to help manage and monitor coastal areas that are used for shellfish farming.
It can be used to analyze environmental data, such as water quality, bathymetry, and wave exposure, to identify suitable areas for shellfish farming.
GIS can be used to map and classify marine habitats, such as seagrass beds, and kelp forests, which can provide habitat for shellfish.
This can be used to identify important habitats for shellfish, and to assess the condition of these habitats.
GIS can be used to map the seafloor, which can be used to identify suitable areas for shellfish farming. This can include identifying areas with suitable substrate, such as mud or sand, for shellfish to attach to.
GIS can be used to analyze spatial data on shellfish farming, such as the locations of farms and the density of shellfish per unit area.
This can be used to identify areas of high shellfish farming activity and to assess the potential impact of shellfish farming on the environment.
To Make Strategic Business Decision
By providing visual representation of spatial data and uncovering connections between specific locations, GIS is a crucial tool for assisting policy planners and organizations in making informed and strategic business decisions.
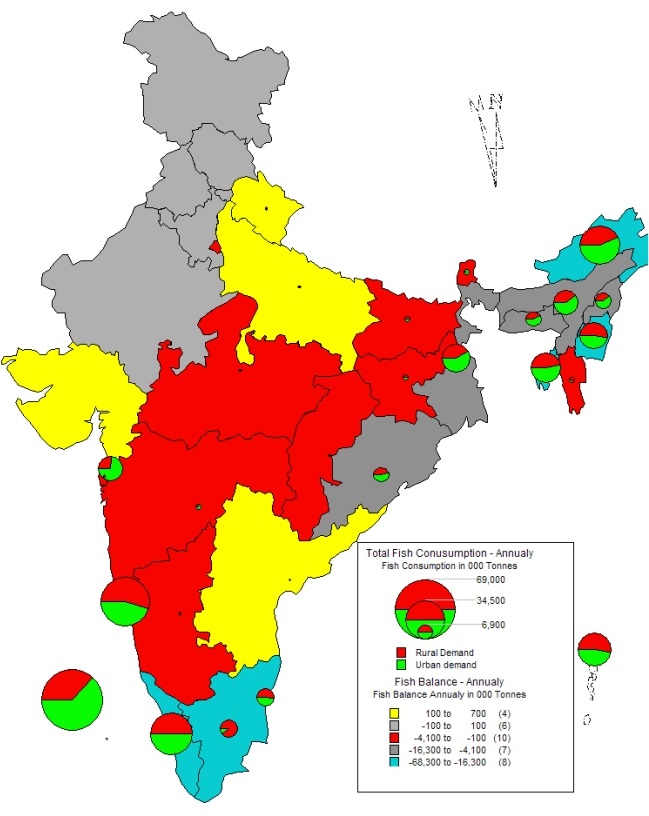
A 2016 study in India by Ram Singh and other researcher utilized state-level fish production and consumption data to evaluate the potential demand and supply of fish with a specific focus on identifying surplus and deficit positions of fish supply at the state level.

Get Small Scale Farming Operation Data
GIS mapping is a powerful tool that can be used to gather and analyze data related to fish farming operations. GIS mapping technology can be used to gather data on small-scale fish farming operations.
This technology allows for the creation of detailed maps that can display information such as the location of fish farms, the size and type of fish being raised, and the water bodies where fish are being farmed.
By using GIS mapping, fish farmers, researchers, and policymakers can gain a better understanding of the small-scale fish farming industry, which can inform decision-making and help to improve the sustainability and efficiency of these operations.

Monitor the Environmental Impact
GIS mapping can be used to monitor the environmental impact of fish farming activities and to identify areas where conservation efforts may be needed.
Use of GIS by Fisheries Management Agencies
A study found that GIS was mostly used by a few individuals within the agency or by contracted service and that barriers such as lack of knowledge or training and limited time limited its wider use.
In conclusion, the application of Geographic Information Systems (GIS) in fisheries and aquaculture has been growing exponentially in recent years.
References
- Eder, B. L., & Neely, B. C. (2013). Use of geographic information systems by fisheries management agencies. Fisheries, 38(11), 491-496.
- Singh, R., Pandey, P. K., Shyam, S. S., & Krishnan, M. (2014). Evolving fisheries business in India with GIS. India Geospatial Digest.
- Fisher, W. (2013). Current issues, status and applications of GIS to inland fisheries. Advances in geographic information systems and remote sensing for fisheries and aquaculture. FAO fisheries and aquaculture technical paper, 552, 269-296.
- Assefa, W. W., & Abebe, W. B. (2018). GIS modeling of potentially suitable sites for aquaculture development in the Lake Tana basin, Northwest Ethiopia. Agriculture & Food Security, 7(1), 1-15.
- Nayak, A. K., Kumar, P., Pant, D., & Mohanty, R. K. (2018). Land suitability modelling for enhancing fishery resource development in Central Himalayas (India) using GIS and multi-criteria evaluation approach. Aquacultural Engineering, 83, 120-129.
- Marble, D.F. et al.. 1983. “Geographic information system and remote sensing ,” Manual of Remote Sensing. ASPRS/ACSM, Falls Church , VA, 1:923-58. Reviews the various dimensions of the relationship between the two fields.
- Dempsey, Caitlin. n.d. Mapping and Geographic Information Systems (GIS). https://researchguides.library.wisc.edu/GIS.
- Joshi, Santosh R, Marc Vielle, Frederic Babonneau, Neil R Edwards, and Philip B Holden. 2016. “Physical and Economic Consequences of Sea-Level Rise: A Coupled GIS and CGE Analysis Under Uncertainties.” Environmental and Resource Economics 813-839.
- Kaymaz, Seyma Merve, and Murat Yabanh. 2017. “A review: applications of geographic information systems (GIS) in marine areas.” Journal of Aquaculture Engineering and Fisheries Research 188-198.
- Padua, Dr. Shelton. n.d. GIS applications in aquatic environment. Kochi: Central Marine Fisheries Research Institute.